There are many ways of evaluating museums, galleries, displays and visitors. One very useful method of working out what people are doing in a gallery space is timing and tracking through observation.
Find out how to in this guide by Sarah-Jane Harknett.
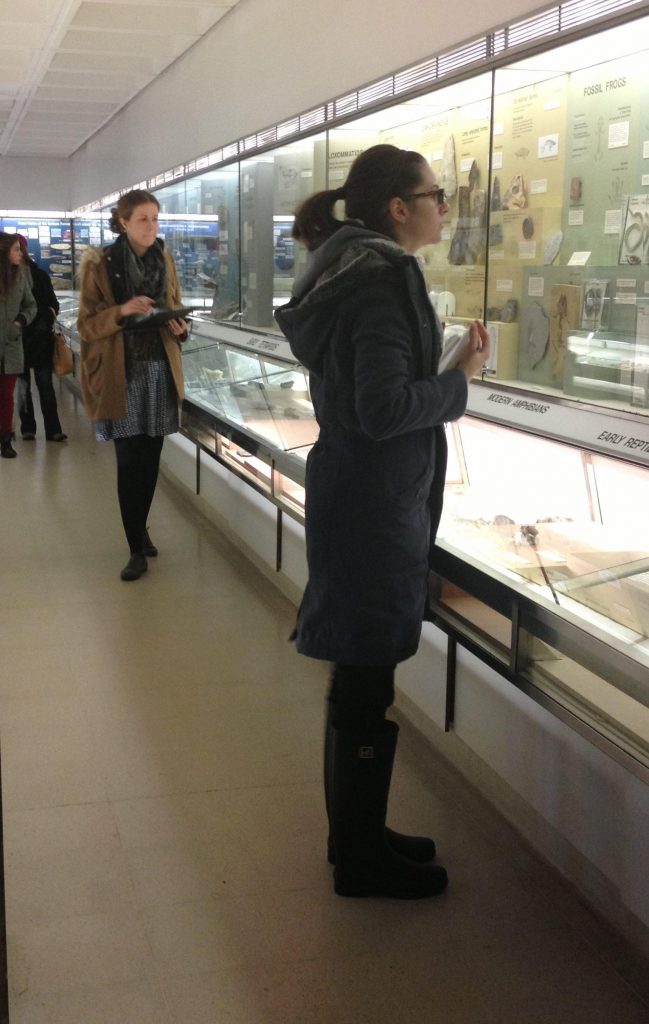
When we track visitors, we are trying to unobtrusively observe where they are stopping, how long they stop for and any other relevant behaviour (such as discussing, photographing etc).
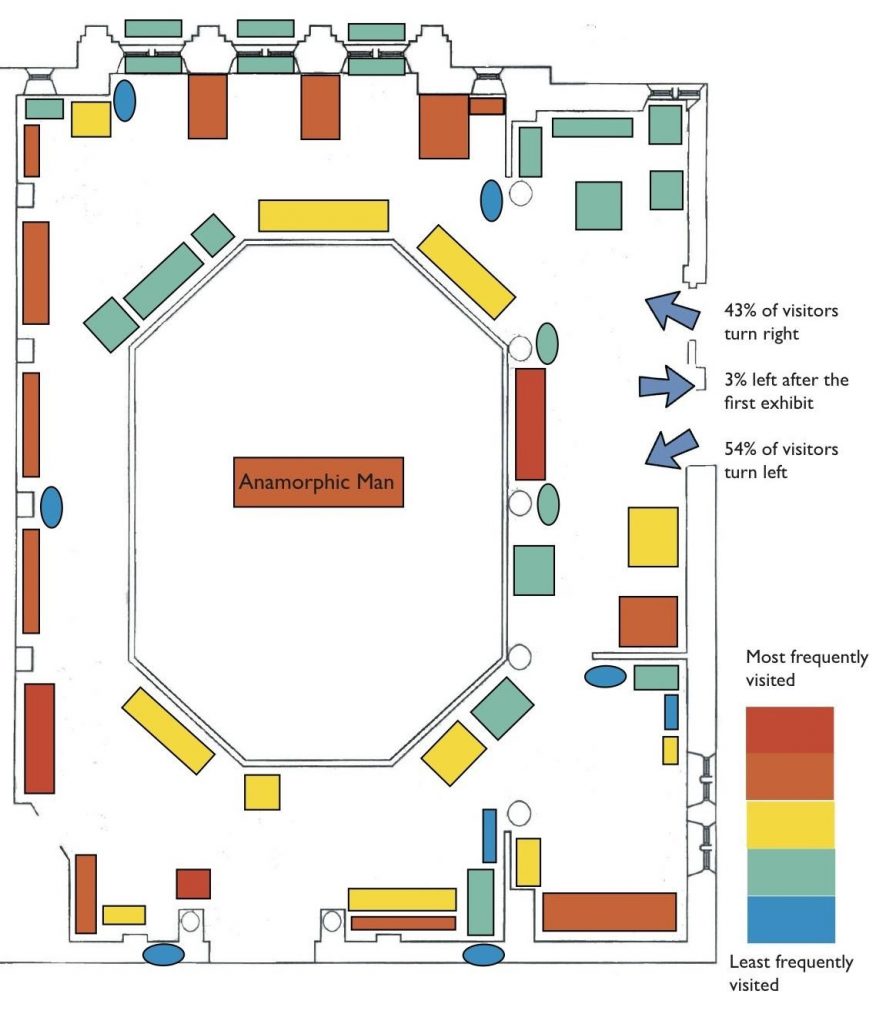
If we combine the results from many visitor trackings, we can make ‘thermal maps’ like the one shown in Figure 1. This shows which parts of the gallery visitors stopped at, which objects, cases or text were popular and which parts were ignored. We can also use the data to see what route visitors took through a gallery and the average time spent.

Other plans can be made showing which cases encouraged people to stop for a longer period of time.
Museums can use this evaluation to make changes to a display, or when they plan other exhibitions. It is most useful to use tracking alongside other forms of evaluation such as questionnaires, interviews or focus groups.

How to track
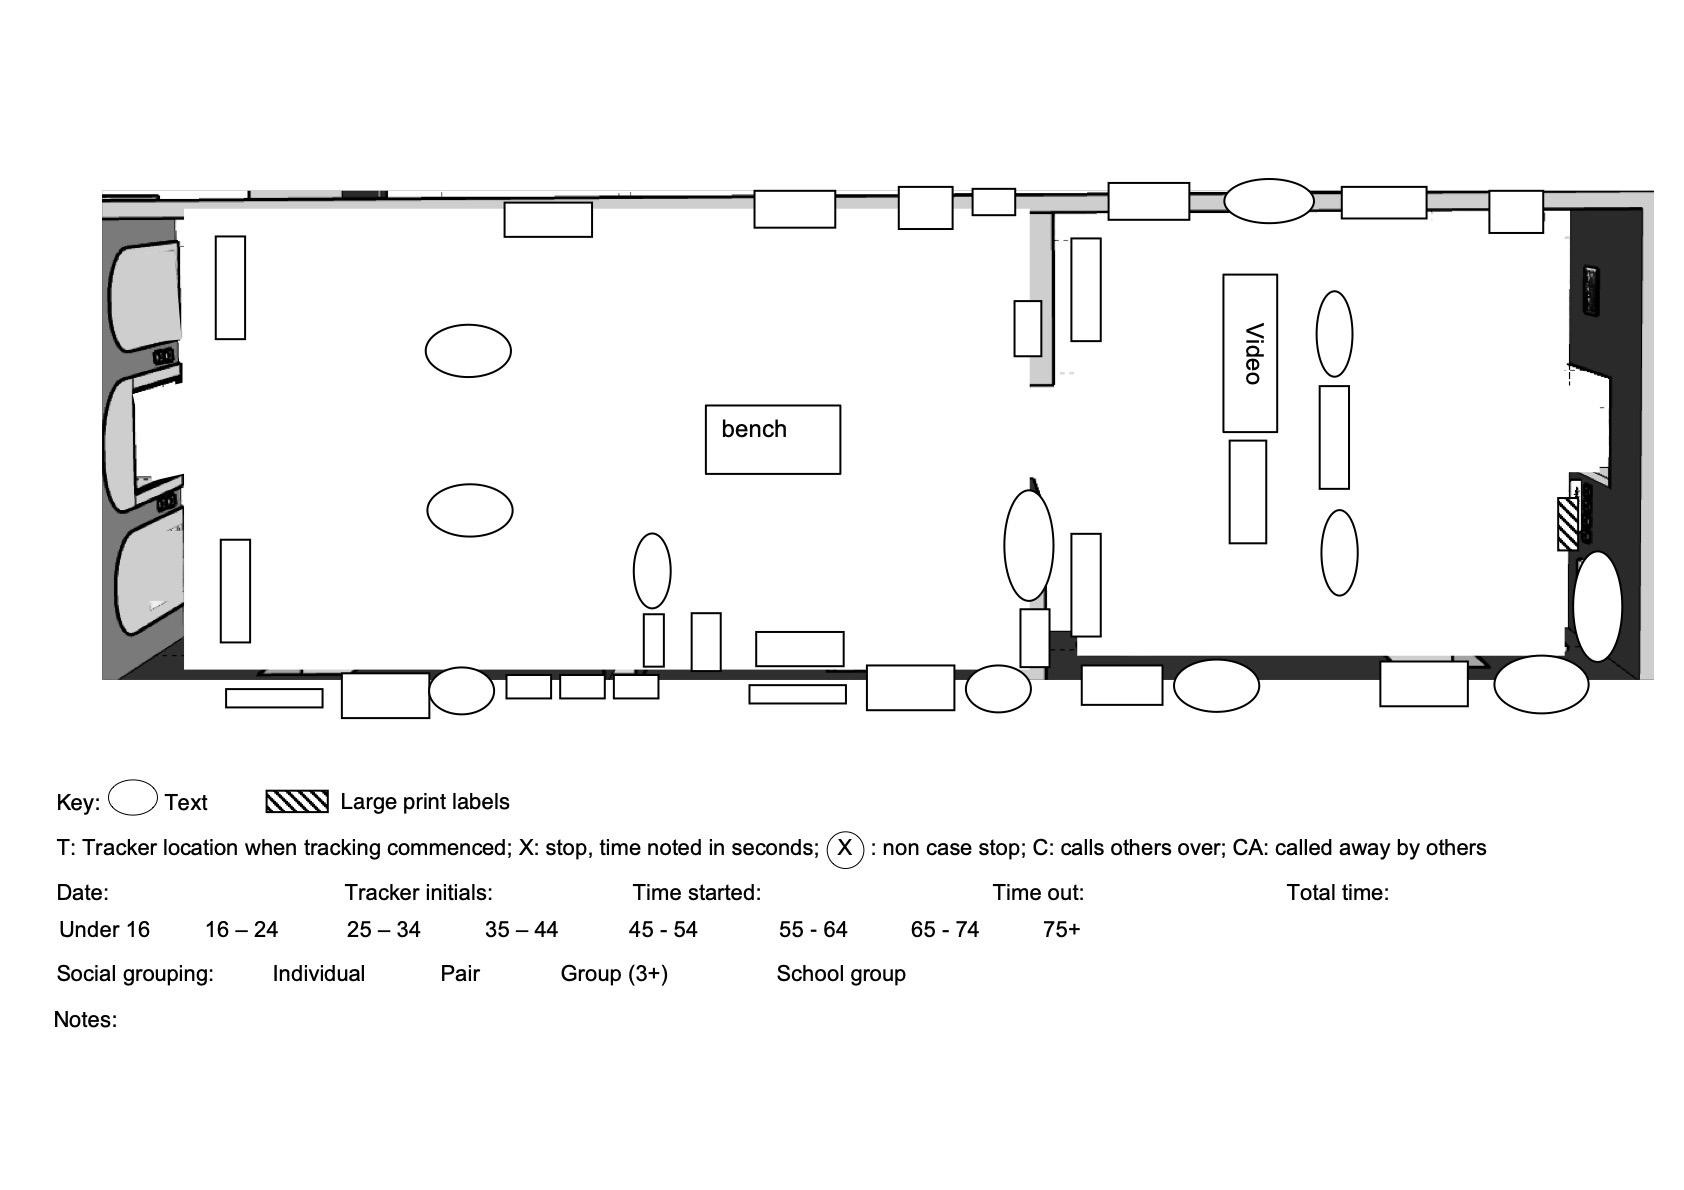
Tracking forms and gallery plans should be tailored for each space to be tracked.
Those doing the tracking should be familiar with these notes and should be quick and accurate at recording information. They should not wear clothes or jewellery that make a noise, as this makes the tracker more self-conscious about their movements.

The person doing the tracking will fill in one plan per person tracked, following only one person at a time. The start and end point should be decided and adhered to. This could be the entrance to the gallery, or the area by a case or interactive.
The tracker will need to choose where to stand to start with. They should mark this point on the tracking form, for example with a T. The observer may need to have several different starting points in order to avoid unduly influencing visitors.
The time the visitor starts their visit should be noted on the tracking form.
Depending on the gallery, the tracker might need to move around to find out where visitors are stopping, or they might be able to stay in one area to make several observations.
Usually, we are interested in all the different elements of a gallery or display. An element could be a case, a text panel, a single object in or out of case, an interactive exhibit, a computer, a book, etc. Mark down every time a visitor engages with an element.
People define a ‘stop’ in lots of ways. At the University of Cambridge Museums we have defined a stop as both feet planted on the floor and looking at the element. If the person you are tracking walks past a case, glancing at it without pausing, it is not recorded as a stop.
For every stop, mark the sheet with an X and add the time.
Use a timer to accurately time each stop and write the time in seconds on the form. This could be a stopwatch, the timer on a phone or other device.
The X should mark the element that is being looked at rather than the exact position of the visitor when they stop: X marks the stop, not necessarily the precise spot. Arrows could be added to the plan to make it clear which element is being looked at. Each individual element that is stopped at should have one time (you should never have one stop marked with arrows to three different cases but a single time).
If the visitor is not looking at an element, mark it as a non-case stop: an X in a circle.
If there is time and it will be useful, add notes to the tracking sheet, for example ‘looking at phone’.
Other behaviour should also be noted on the tracking form. For example, the study might be recording which elements are photographed, discussed, interacted with. Use the simple codes on the tracking form (eg P, D, I) to quickly record this.
For movement between elements, use arrows to indicate the direction the visitor is moving.
When the visitor leaves the space, note down the time the tracking finishes.
Record broad demographic information at the end of the tracking. Age will be an estimate only, it’s just to try and get an even spread of ages.
At the end of each tracking, the volunteer should carefully check the tracking sheet. Each stop should be at an individual element, with a single time per element. It should be completely clear which element the visitor was engaging with.
Once you have completed a tracking study, you should use the sampling strategy for your project to select the next person for tracking. This could be the third person through the door once the tracking has finished, or could be the next person if the venue is quite quiet.
In order to maintain focus and concentration, a session for visitor observation should be no longer than 2 hours. Depending on the venue, in 2 hours between 1 and 20 tracking studies could be completed. Try to ensure tracking sessions are evenly spaced over the venue opening times, covering weekends, holidays, term times etc.
Ethics
We are interested in what visitors would naturally do in the observation space, so we do not ask permission before the visit begins. It would be unethical not to give people notice of the evaluation and the option to withdraw from the study. Each gallery being studied should have a sign prominently posted. The sign should read something like:
“We are currently evaluating our displays in this gallery. The information we are gathering will be used to improve future exhibitions.”
Make sure the sign is put up before the tracking starts.
If there are gallery attendants present in the gallery, they should be informed that tracking is taking place. Evaluators should introduce themselves to the gallery attendant before they start tracking.
Anyone evaluating visitors should be ready to explain what they are doing if they are approached, either by the person they are tracking, or any other visitor. If someone would like to withdraw from the study, the tracking sheet should be removed and disposed of. A note should be made that there has been a withdrawal.
What to do with the data

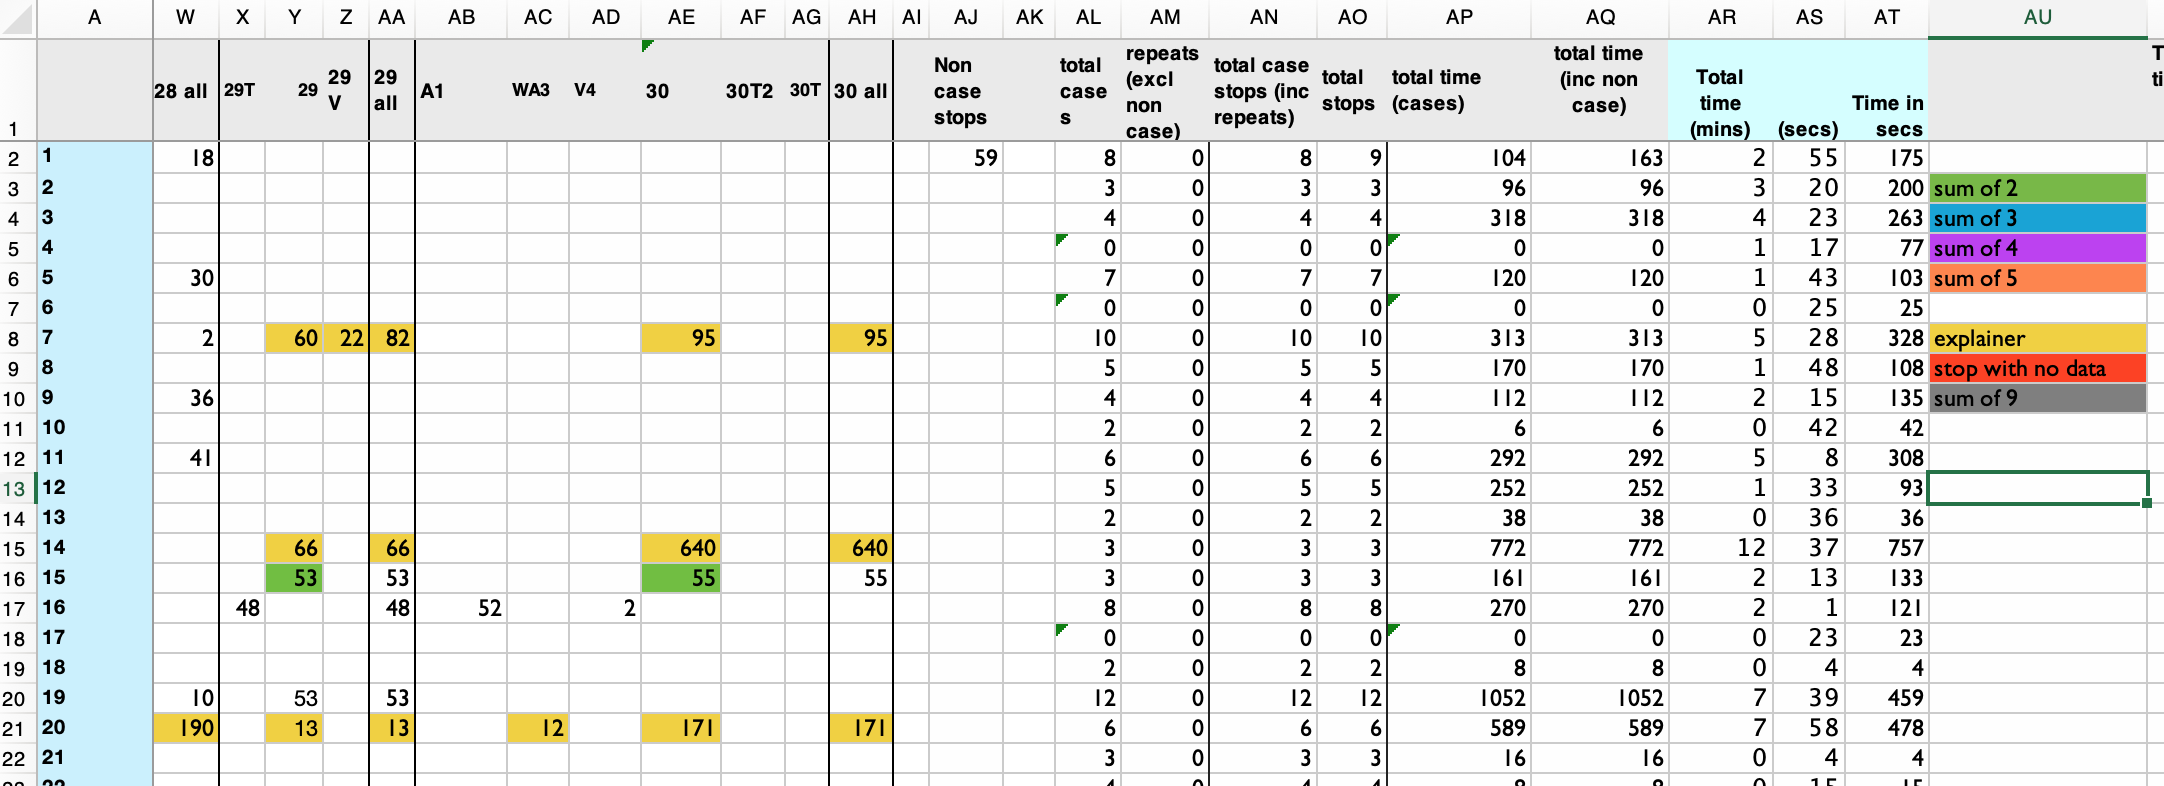
You will need to analyse the data. The simplest way is to create an Excel spreadsheet. In Figure 4, the elements have been numbered and are the column headers. Each tracking sheet is also numbered, and entered in a row. The time spent at each element is entered in the relevant column.
Various calculations can be performed using the data. For example, average time spent in the gallery by person or by element. Multiple trackings can be used to create thermal plans (such as Figure 1). Different plans could be created for average number of stops per element, average time spent, or focussing on particular element types (interactives, 2D artworks, artefacts, etc).
Plenty of time should be given to entering and interpreting the data.
This guide was created by Sarah-Jane Harknett.
